Baltic Renewable Energy

Say No to Greenwashing

There are a number of providers out there making unsubstantiated claims to deceive customers into believing that a company’s products are environmentally friendly (Greenwashing). We believe that it’s really hard for a customer to know how environmentally friendly a company can be. Here’s how we score so far.

(For full transparency, we do encourage customers to visit our facilities for further inspection (by appointment only).

We recycle 100% of our waste

By re-using packaging, materials, waste paper and cardboard, we produce a low level of waste in our day-to-day operations which is sent for recycling

50% of our vehicles are electric

and we charge them using green electricity, either generated by ourselves, or imported during off-peak times. We even use the regions e-scooter’s to attend customers call-outs!

We run our server rooms at 28C

cooling them only with natural ventilation, while using any excess heat to heat our offices.  Any additional excess is provided to neighbouring buildings, providing us with a way to remove heat while helping others reduce their carbon footprint

We import Green Energy

Where we have to import energy into our various sites, we source a mix of renewable and nuclear energy from our chosen supplier so that we can be as sustainable as possible for our consumption.

We time-shift electrical loads

Non-urgent computing functions (such as billing, backups etc) are performed during peak generation times that effectively time-shifts our electrical loads (where possible) to when energy is plentiful

1500Ah of Battery Storage

We use our backup batteries as energy storage as well, storing our renewable energy for  later consumption (during low solar generation periods).

Efficient Use of Water

We use a very low amount of mains water and when we do, it is stringently metered and monitored for efficiency and low wastage.

We re-use, re-condition all of our IT equipment

only replacing when necessary

We use energy efficient power supplies in our equipment

By using high efficiency electronic components in our equipment, we reduce the standby loads by up to 50%, simply by using things smarter.

Our Renewable Statistics

3
Renewable Energy Plants
52
of Installed Power

18

Exported to the Local Grid
2
Storage Facilities

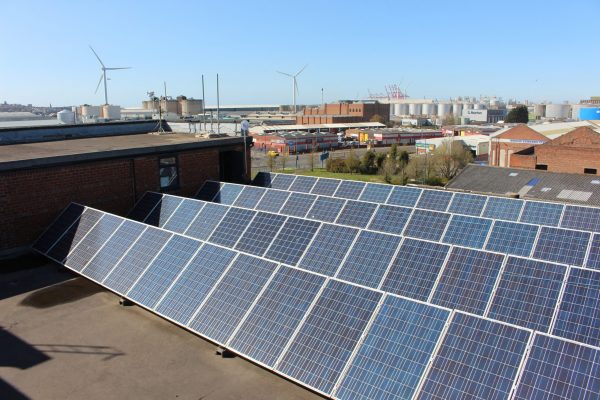
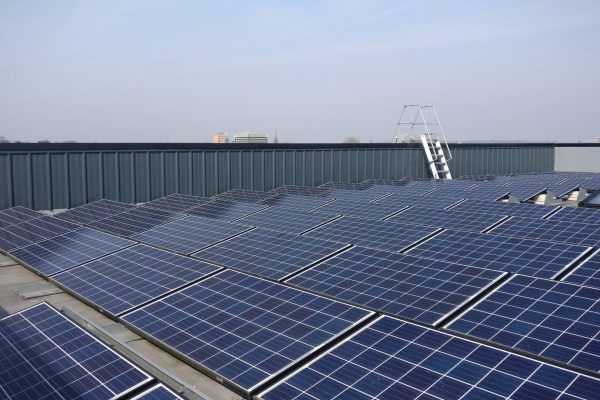
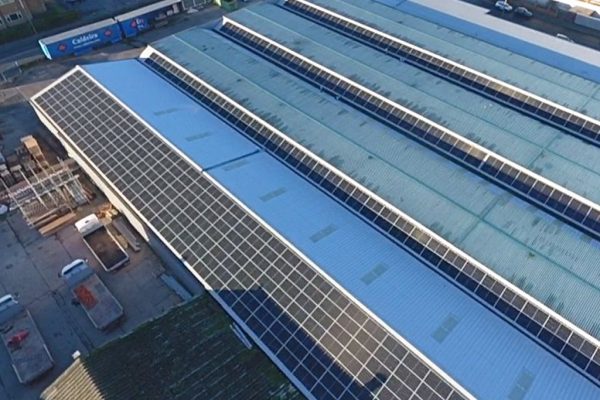
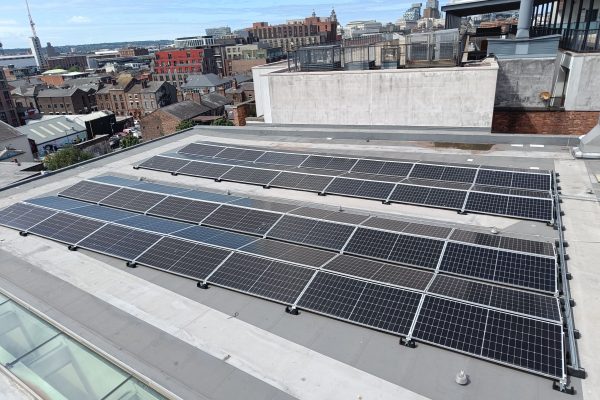
Solar Generation Site Examples

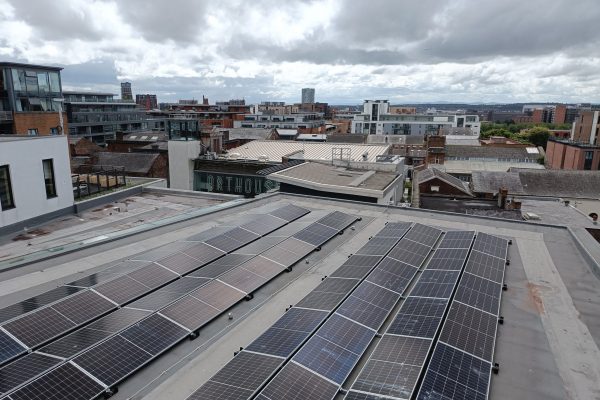
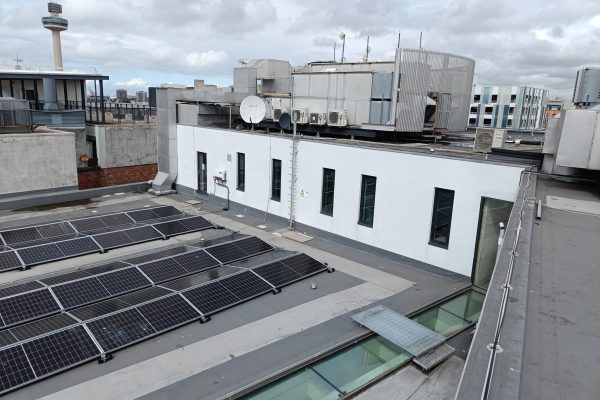
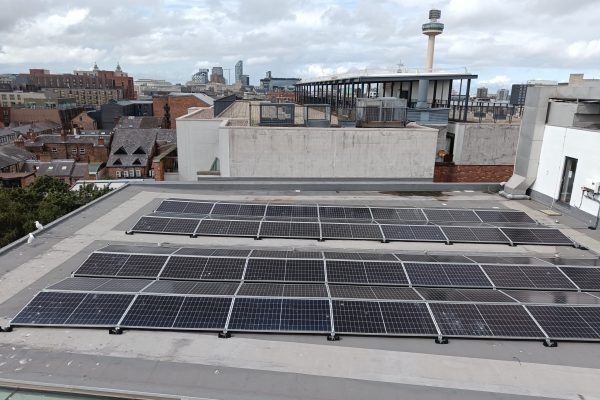
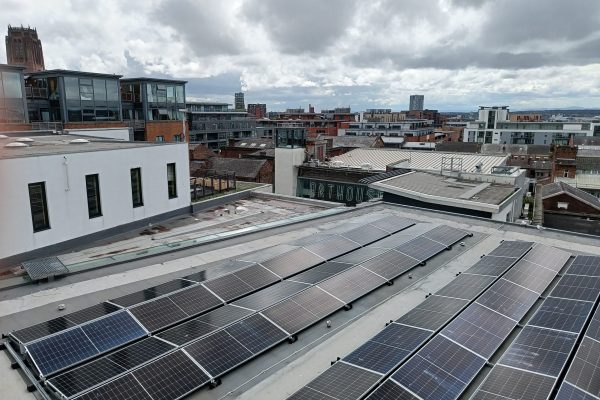
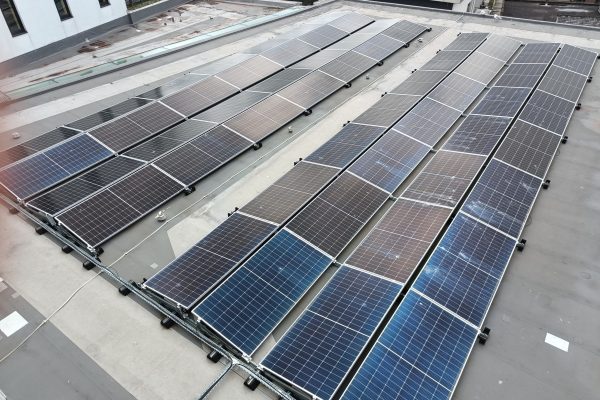
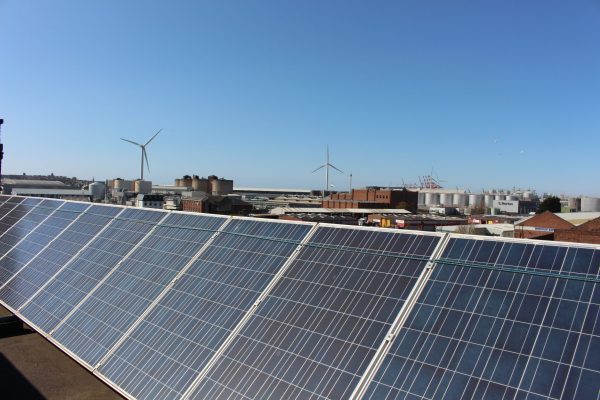
Below are photos of our various generations sites that power our network, including the new huge £3m New Caldeira Knowsley Headquarters

Real-Time Generation

Below is our real-time data that captures both our energy generation and consumption from various parts of our network. We built this system in-house to help demonstrate both what can be monitored, but also to show how little energy consumption that we use compared to the various services we operate.

Generally, as we store a lot of our energy in batteries, we tend to use that power of an evening when our solar doesn’t generate.  We tend to re-charge these when our generation is at peak levels, just before we export back into the grid. A negative value shows that we are over-generating so are exporting.

The dials and graphs below are updated every 30 seconds from our sites around the region.

Liverpool City Centre (North)

Our North Liverpool site is the largest generation asset in our network.  As a roof-top site north of the city that is facing south, it has the capacity to generate over 36kw of power.

 You’ll see that most of the time, our consumption is fairly static due to the always-on nature of our business, operating servers, routers, switches and radios, these consume little, but we have a lot of them!

Trend Graph – Generation (W)

Trend Graph – Consumption (W)

Trend Graph – Voltage (V)

Liverpool City Centre (South)

Our South Liverpool site is a similar operation.  It has the capacity to generate up to 24kw of power from 64 solar panels, but it includes a small self-built storage facility.

As the South site also has it’s own sub-station, it reduced the probable losses in transmission during exports, which helps improve efficiency and usage from our neighbours who are connected to the same building supply.

Trend Graph – Generation (W)

Trend Graph – Consumption (W)

Trend Graph – Voltage (V)